


Physical Oceanography Conditions in the Gulf of St. Lawrence in 2014
Every year, through the Atlantic Zone Monitoring Program (AZMP), Fisheries and Oceans Canada assesses the physical oceanography conditions in the Gulf of St. Lawrence. The AZMP was implemented in 1998 with the aim of increasing Department’s capacity to understand, describe, and forecast the state of the marine ecosystem and to quantify the changes in the ocean’s physical, chemical and biological properties. This information is essential to ensure the sound management of the St. Lawrence ecosystem, conserving resources and protecting the marine environment for future generations.
2014: a year of records
Here are a few highlights for 2014: an almost-record sea-ice cover in winter was followed in August by perhaps the warmest surface temperatures in 140 years, while deep water temperatures were the highest in 100 years!
The winter of 2014 was the coldest since 1993 over the Gulf, creating a thick surface layer that had near-freezing temperatures, as well as a sea ice cover with the third highest seasonal maximal since 1969, at nearly double the climatological average.
The cold intermediate layer is typically located at a depth between 20 and 120 m and encompasses cold waters with temperatures below 1 or 2°C, cooled during the previous winter. The summertime cold intermediate layer (CIL) returned to near-normal conditions after four years of warm conditions, as a result of the cold winter.
The sea-surface temperature averaged from May to November over the Gulf was above-normal by +1.2°C and second highest on record after 2006. A record high was reached in August with a Gulf-average anomaly of +2.5°C, breaking the +2.0°C record of August 2012. Record highs were also set in the following regions: Estuary (+4.2°C), Northwest Gulf (+4.1°C), Anticosti Channel (+2.8°C) and Cabot Strait (+2.9°C). Deep water temperatures are increasing overall in the Gulf, due to currents from Cabot Strait. In 2012, at a depth of 200 m, the water temperature reached 5.3°C, a record high since 1915).
Temperature at 300 m increased in 2014 to reach 5.9°C, the highest value since 1980. Bottom area covered by waters warmer than 6°C increased in 2014 in Anticosti Channel, Esquiman Channel and Central Gulf, and reached a record value in Esquiman Channel while reducing its bottom habitat area in the temperature range of 5–6°C.
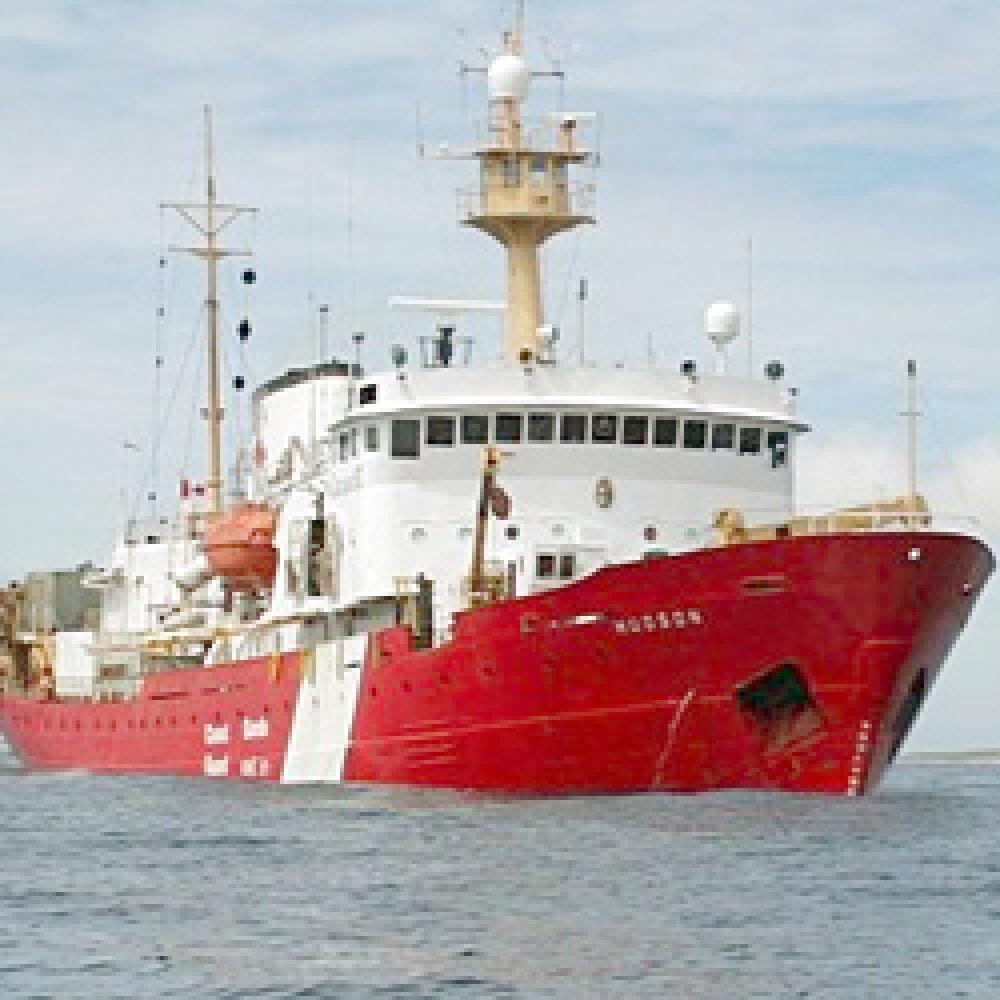
A harsh winter keeps icebreakers on the alert
Infoceans – August-September 2014
Peter Galbraith
Sciences
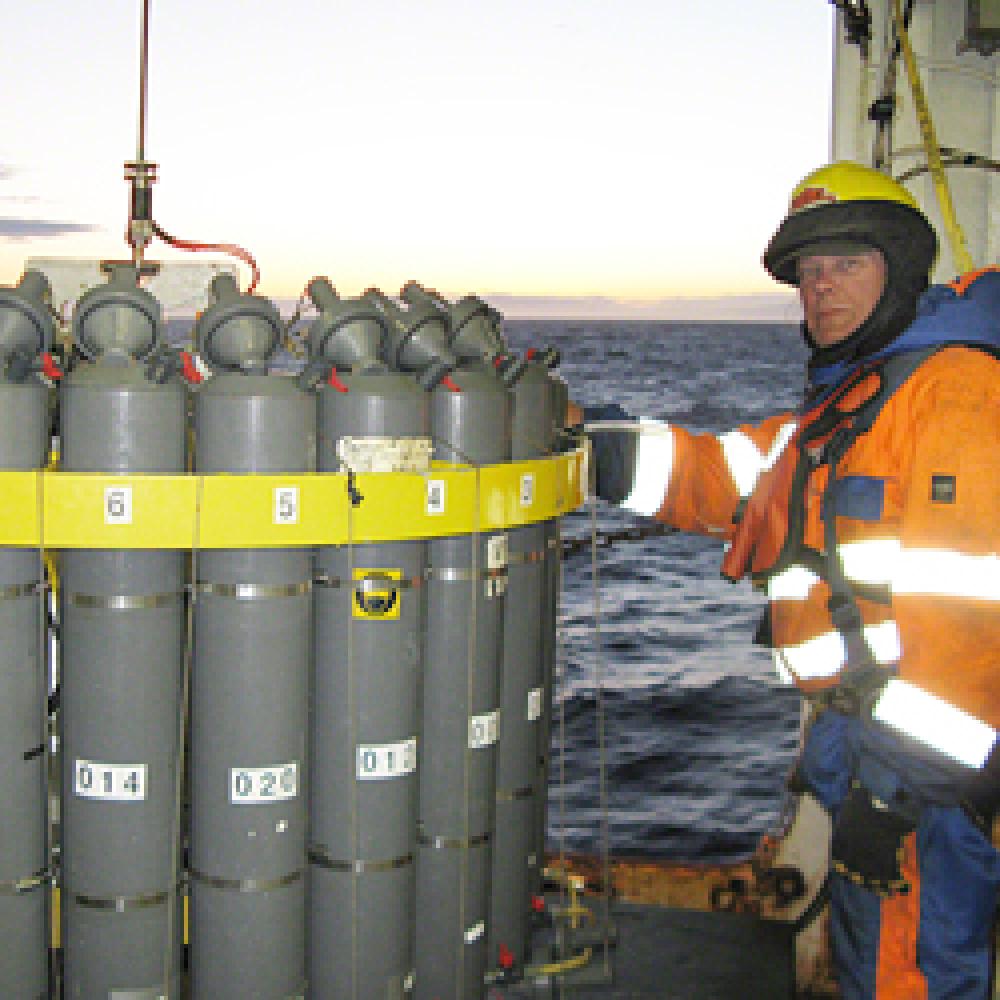
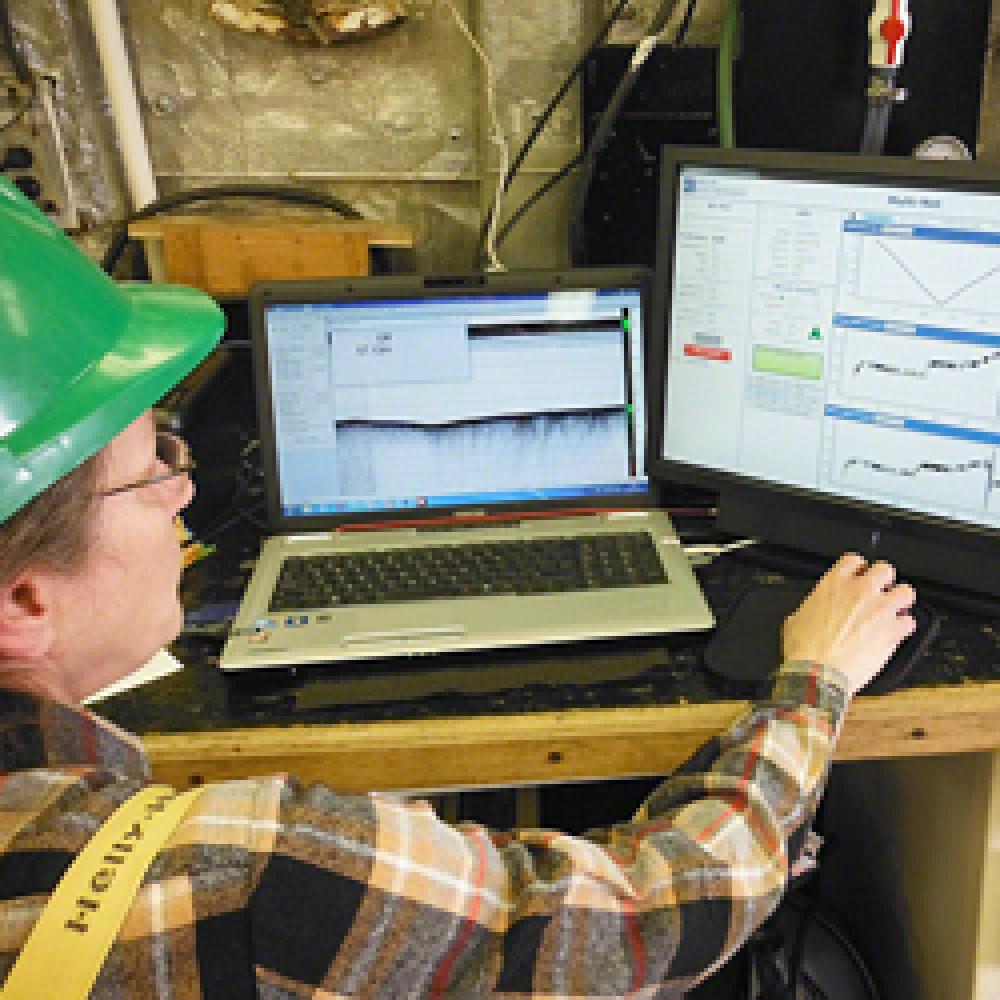
The data are transmitted on
board to be analyzed by scientists.


